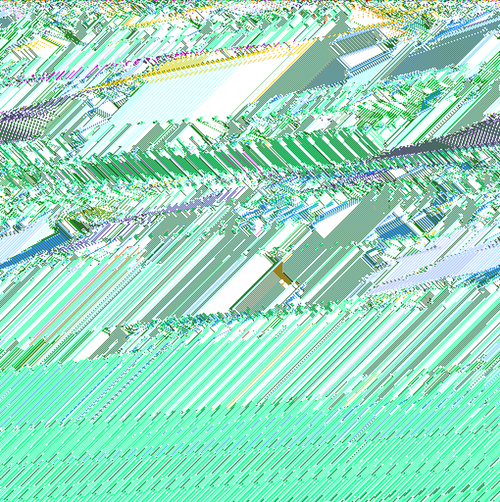
 Barricelli experiment recreated with Processing by Galloway. Barricelli’s visualization technique has been altered—color has been added to show the gene groups more clearly, and the vertical axis has been compressed to increase the amount of evolutionary time that is visible. Each swatch of textured color within the image indicates a different organism. Borders between color fields mean that an organism has perished, been born, mutated, or otherwise evolved into something new
The latest issue of Cabinet inclues an essay by Alexander R. Galloway on mathematician Nils Aall Barricelli, who created artificial evolution experiments in the 50s, with a striking visualization technique:
How did it work? Barricelli established a “universe” consisting of a horizontal row of 512 genes. Genes were represented using integers from negative 18 to positive 18. According to “norms” he established governing mutation and reproduction, each number reproduced into the row below it. in this way, the norms translated rows of “parent” genes into subsequent rows of “child” genes, which in turn were reproduced again using the same norms into subsequent generations over and over. if and when gene-numbers reappeared in a sustained group, Barricelli would designate each group an “organism.” proceeding in lines from top to bottom, Barricelli’s algorithm produced a rectangular image consisting of a grid of genes appearing as individual pixels. When finished, the image yielded a snapshot of evolutionary time, with the oldest generations of organisms at the top and the youngest at the bottom. the output of Barricelli’s experiments was highly visual. he was essentially drawing directly in binary numbers, converting 1s and 0s into pixels in either on or off positions. Because he represented each gene as pixels, organisms were identified visually based on how the pixel patterns self-organized into texture fields, which were identified as shapes or zones within the image. Variations in texture delineated one organism from another, and the width and height of any given texture field indicated the lifespan of an organism.
Proceeding in lines from top to bottom, Barricelli’s algorithm produced a rectangular image consisting of a grid of genes appearing as individual pixels. When finished, the image yielded a snapshot of evolutionary time, with the oldest generations of organisms at the top and the youngest at the bottom.
The output of Barricelli’s experiments was highly visual. he was essentially drawing directly in binary numbers, converting 1s and 0s into pixels in either on or off positions. Because he represented each gene as pixels, organisms were identified visually based on how the pixel patterns self-organized into texture fields, which were identified as shapes or zones within the image. Variations in texture delineated one organism from another, and the width and height of any given texture field indicated the lifespan of an organism