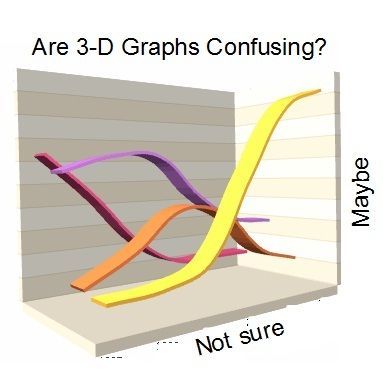
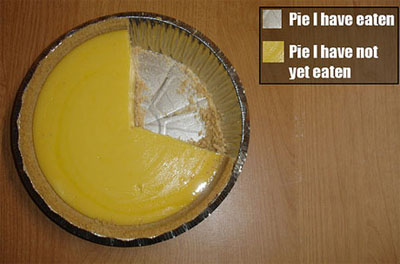
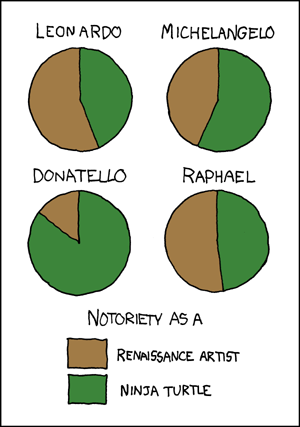
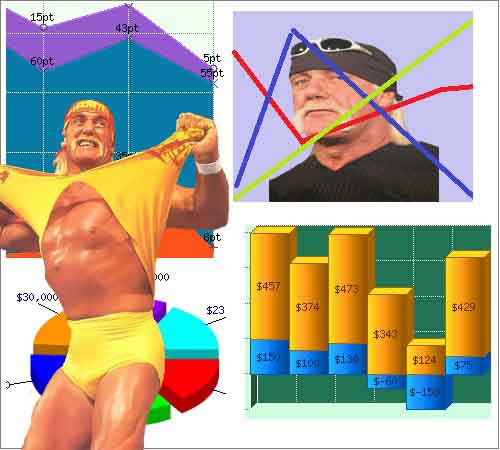
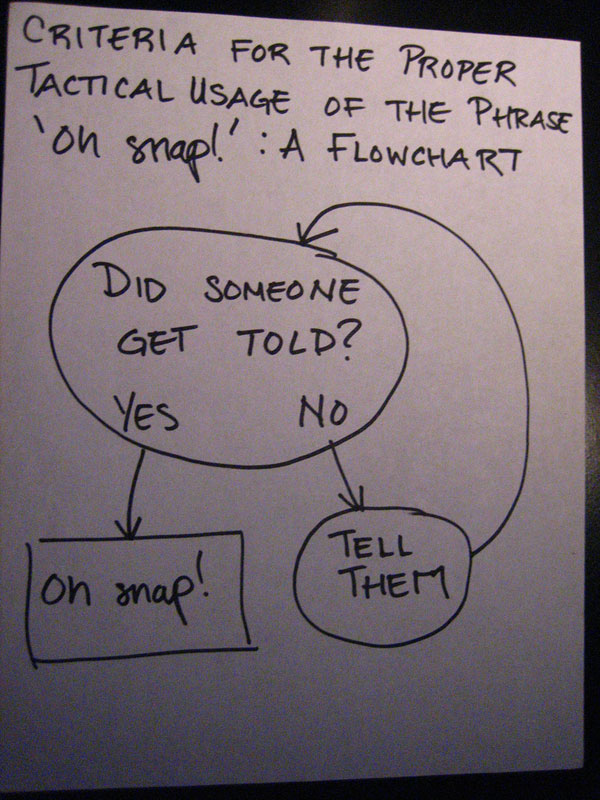
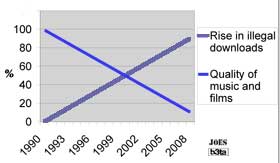
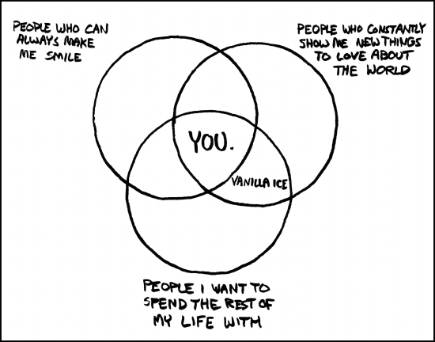
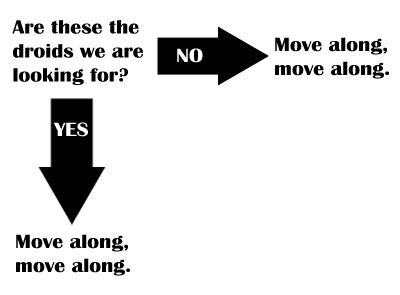
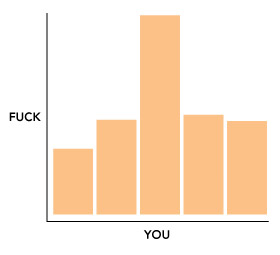
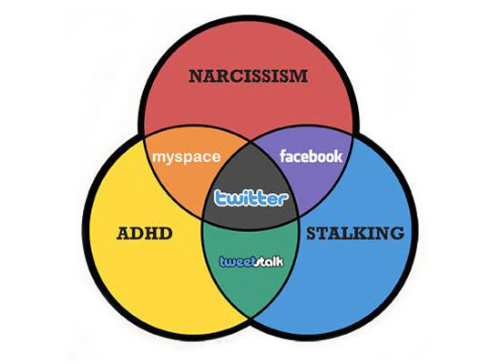
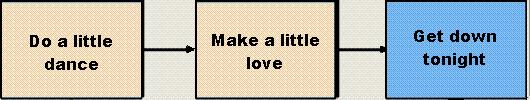
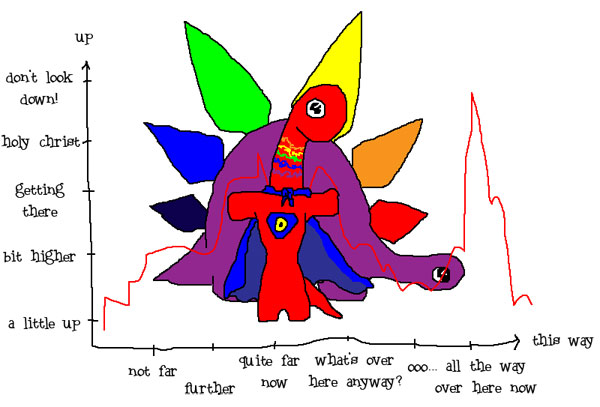
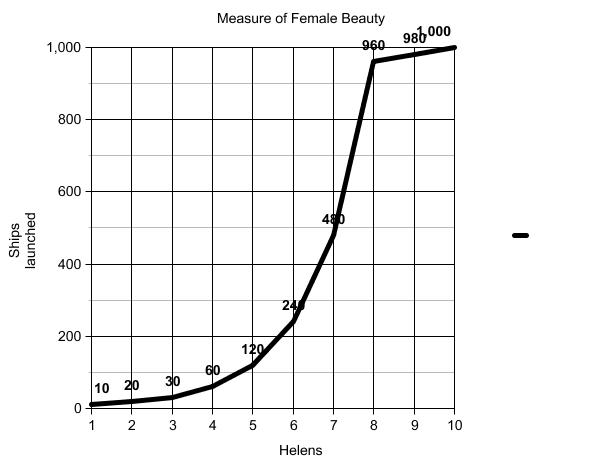
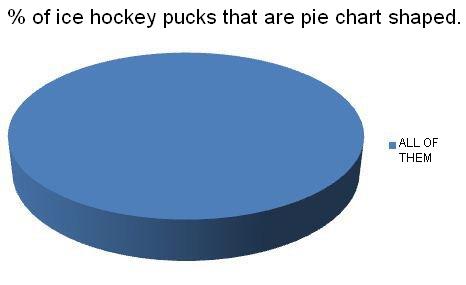
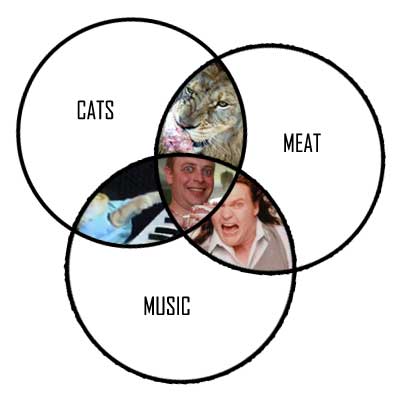
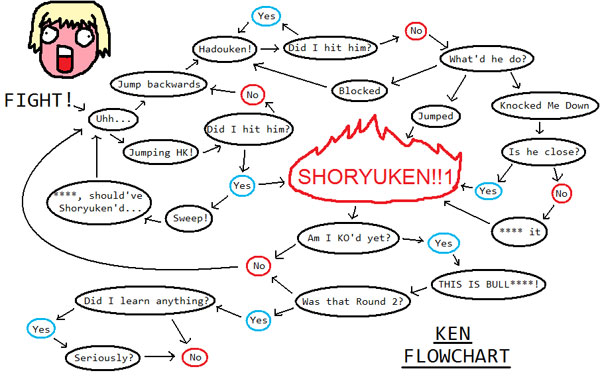
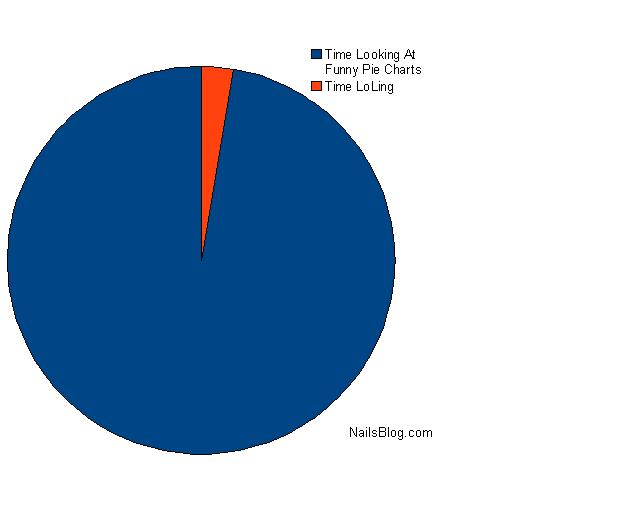
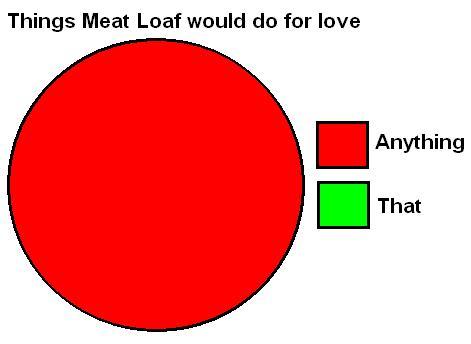
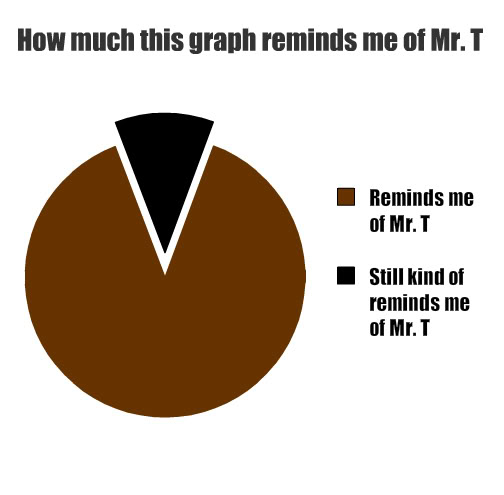
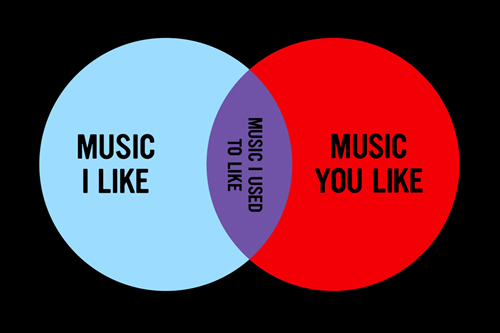
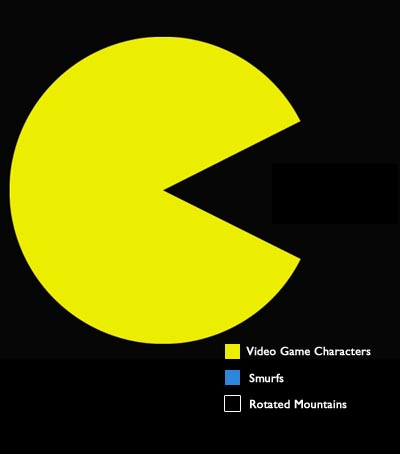
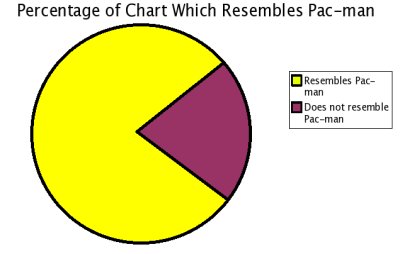
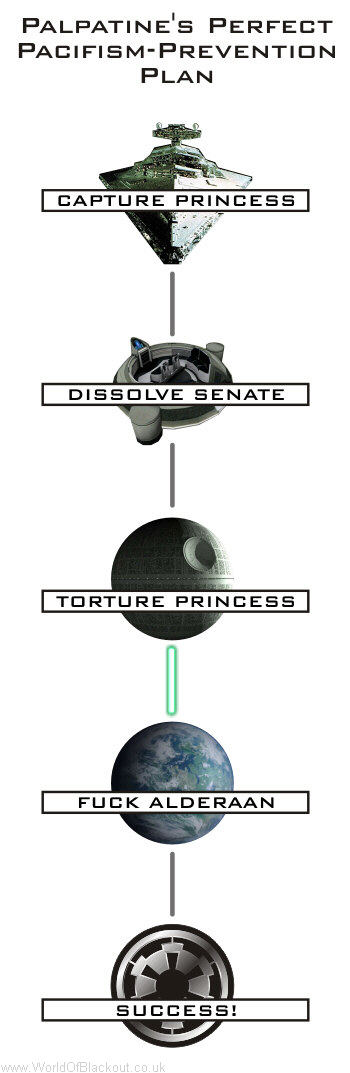
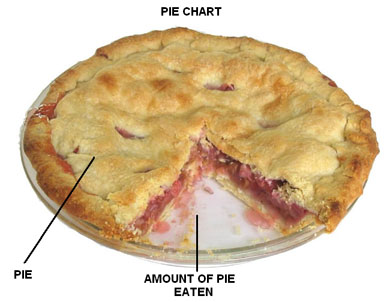
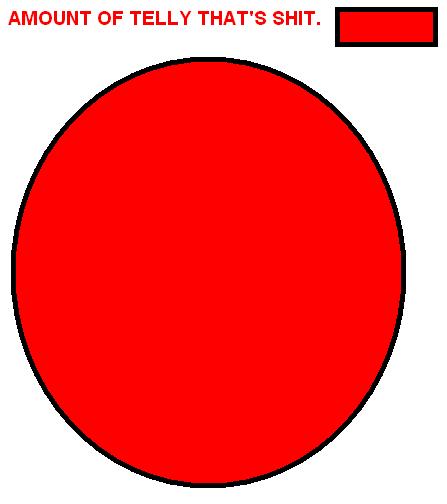
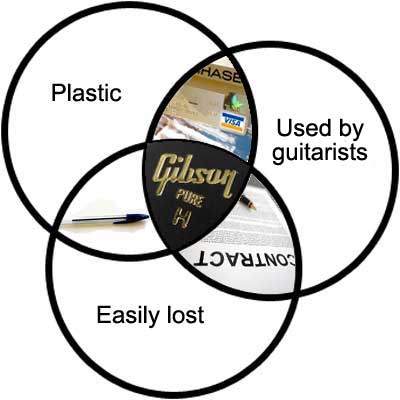
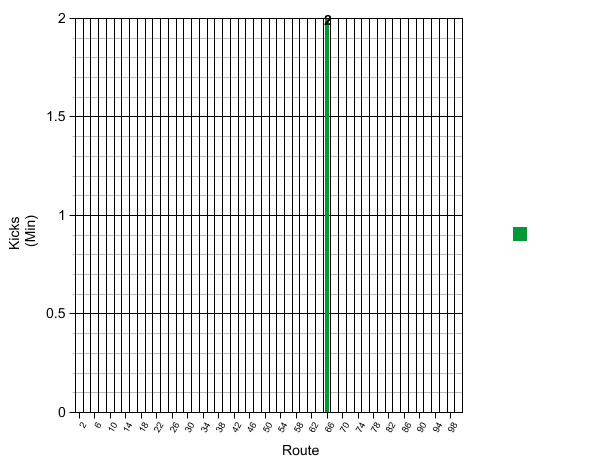
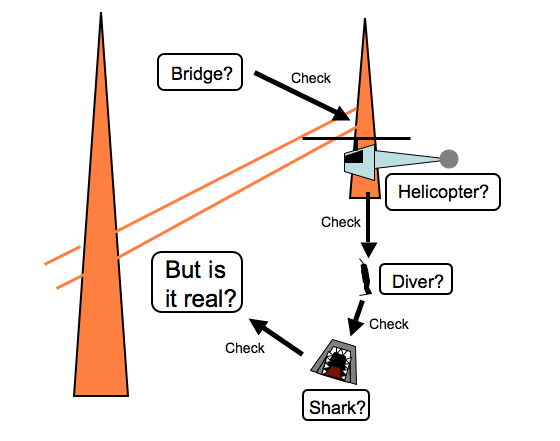
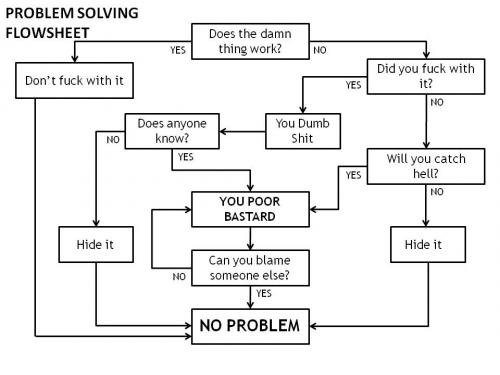
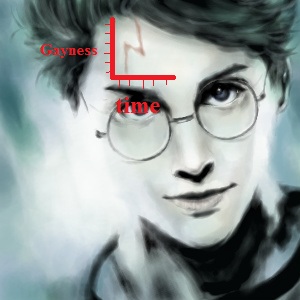
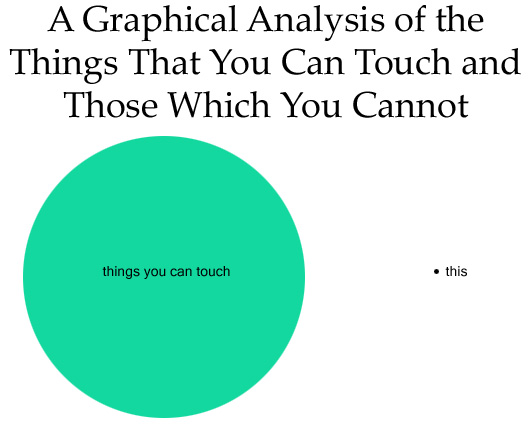
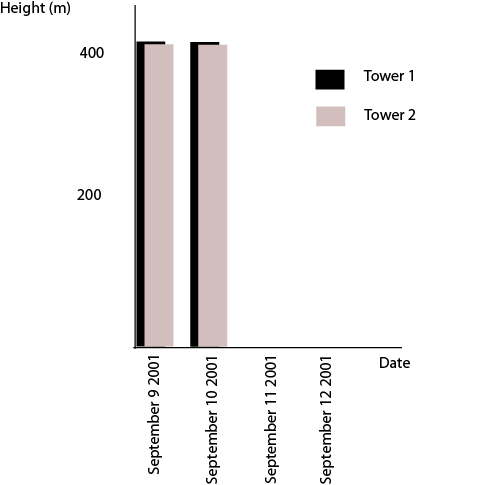
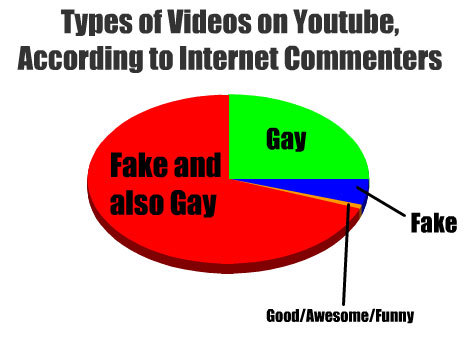
For today's General Web Content I have assembled a collection of images that repurpose traditional models of data visualization for humorous/bizarre/illuminating effect. This meme has been around for several years now, first coming into mainstream awareness with the emergence of the overwhelmingly brilliant website "rap represented in mathematical charts and graphs," and continues to be a persistent mechanism for creative expression across the web. (Especially in forums such as b3ta, 4chan, and Something Awful.) The intent of this collection is not to present a best of, but merely to convey a broad overview of the meme. Enjoy.