The earliest form of data visualization is a clock. The Color Clock converts time data into color data. At first the colors may seem random but you will eventually get to know the clock and be able to tell the time.
Full Description
When the Egyptians divided the day into hours by converting sunlight into time information they were tinkering with data visualisation. Other creative time visualisations have been created throughout history such as the water clock, the hourglass, mechanical clocks etc.
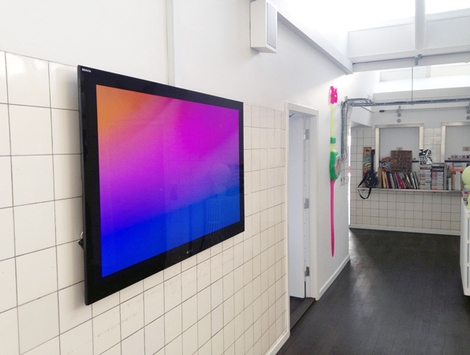
The Color Clock is a HTML/Javascript piece that converts time data into color data. The way the clock converts time data into color data is by converting the cycles of seconds, minutes and hours into a color cycle which goes from red to blue to green to yellow and red again. The upper right corner displays the seconds, the upper left corner the minutes and the bottom area the hours. These colors are combined to create a 3 point gradient.
Work metadata
- Year Created: 2013
- Submitted to ArtBase: Wednesday Oct 30th, 2013
- Original Url: http://www.frederikkrogh.com/works/colorclock/
-
Work Credits:
- Frederik Krogh, primary creator
Take full advantage of the ArtBase by Becoming a Member


