Nicholas Felton spends much of his time thinking about data, charts and our daily routines. He is the author of several Personal Annual Reports that collate countless measurements into a rich assortment of graphs and maps reflecting the year’s activities. He is the co-founder of Daytum.com, a site for counting and communicating daily data, and a member of the product design team at Facebook. His work has been profiled in publications including the Wall Street Journal, Wired and Creative Review. 
While Felton's commercial studio has produced design and data visualization engaging problems in broad areas from politics and policy, to food and travel, his personal practice is known for its simple storytelling ability. Felton tracks and visualizes personal matters such as modes of travel, social relationships and conversation, food, and emotion. The sole product of this logging and visualization is the Feltron Annual Report. His Annual Reports are illustrative of this cultural moment where the "anthropology of ourselves" (anticipated in the 30's by the mass observation movement) is a more feasible reality. With terabytes of social data being voluntarily created and shared, phenomenological and sociological analysis of human behavior has never held more potential. In the face of this, Felton turns to offline phenomena. In the age of big social data he tracks and manifests the ephemeral intangibles left behind by an individual. He is a documentalist in the Otlet tradition, extracting data from an action or thing, and deriving information through relationships between phenomena. He quantifies and visualizes the mundane, but in the end Felton's annual reports are about the story, not the analysis. Over the course of five years, his annual reports have crafted the outline of a character. A man of few (but carefully chosen) words, Felton's reports provide only enough detail and analysis to engage the reader, but leave enough unsaid. The annual reports are produced as finely printed print editions, available for the cost of a good book. Their physical form reinforces this notion of storytelling, in some way they are a further abstraction of the graphic novel.
BF: Looking at your evolution, I see a designer who came to data vis, and found a vehicle for storytelling in personal data. NF: I'm using the tools of data vis to do my storytelling. I'm interested in just finding ways of creating a record of existence and behavior, and seeing what it looks like, and trying to figure out what the aggregates have to share. Whether its something that's interesting or humorous or tragic.
 Feltron 2007 Annual Report, page two
BF: You've spoken of experimenting with the content of others in the past – namely authors. Does this precede the annual report? NF: Yeah, that's what I did for my thesis at RISD. I read Catch 22 while I was in Japan, and it kind of changed it for me, thinking about Japan's WWII experience, and I was reading about Italian fear of war, and it became very visual for me – there were a lot of weird conversations that were hard to put together on the page. I made maps of that stuff, and eventually I was treating Catch 22 like it was real, and making artifacts from it. In the spirit of Catch 22 I made artifacts that weren't in the book, but came out of that contradictory world. That's when I felt like I was always going to be bound to the book; if you hadn't read it then the things that I made were kind of disappointing. I think thats why I was looking for better sources. The next project I made was a postcard project, where my girlfriend and I at the time took our activities in New York and transposed that onto an imaginary road trip. So that was kind of a blend of this world and a fictional world, and that was probably my first trial with taking day to day experience and turning it into a design exercise.
 Paul Otlet – Documentation and its Parts
BF: It is clear that people find your work compelling because of this narrative. In a way that is the foundational element of data vis – illustrating the story in the data. Yet you're not offering too much – while your subject is yourself, you leave plenty of space for the reader to fill in what they would like. It becomes more about a character that is a combination of your data and the reader's assumptions. NF: I thought the latest one was really interesting as a counter point to the previous reports as well because it was someone who didn't track their life with the intention of doing anything with it.

2010 Feltron Annual Report – table of contents (detail)
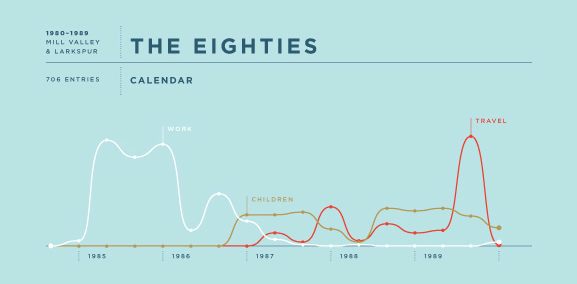
BF: This report was generated with data gleaned from physical ephemera, which is quite a change from your previous reports. The table of contents provides an interesting look at this, as it is provides a perspective of to what degree your father documented his life. NF: You can see the points of high resolution and low resolution, no resolution. You can see a drop-off when he married my mother - the recording fell onto her. She started taking the photos, and she started being the documentarian of the family and then they got divorced here (points), and suddenly he's back in charge of logging data again. The main hurdle was trying to get a cohesive timeline. Taking the slides, trying to mesh those with calendars and make sure that everything lined up. There was a ton of data entry – thirty years of calendars that I typed out. Then there was the forensic side of the equation, trying to find where slides were taken.
 2010 Feltron Annual Report (detail)
BF: Who are your peers? You are usually lumped in with data vis people, and fair enough, but with the reports, you are cultivating something else. NF: I think I have my feet in a lot of different camps. There are the obsessives that I really admire like Sophie Calle, [Candy] Jernigan, who have done sort of quantitative artwork – the scientific approach to artwork. Then there are the people on the technology side that I look to, like Zach Lieberman, Casey Reas, and Ben Fry. Felton has recently accepted a position at Facebook, where he and Daytum co-founder Ryan Case will be working on projects involving data and the social graph.